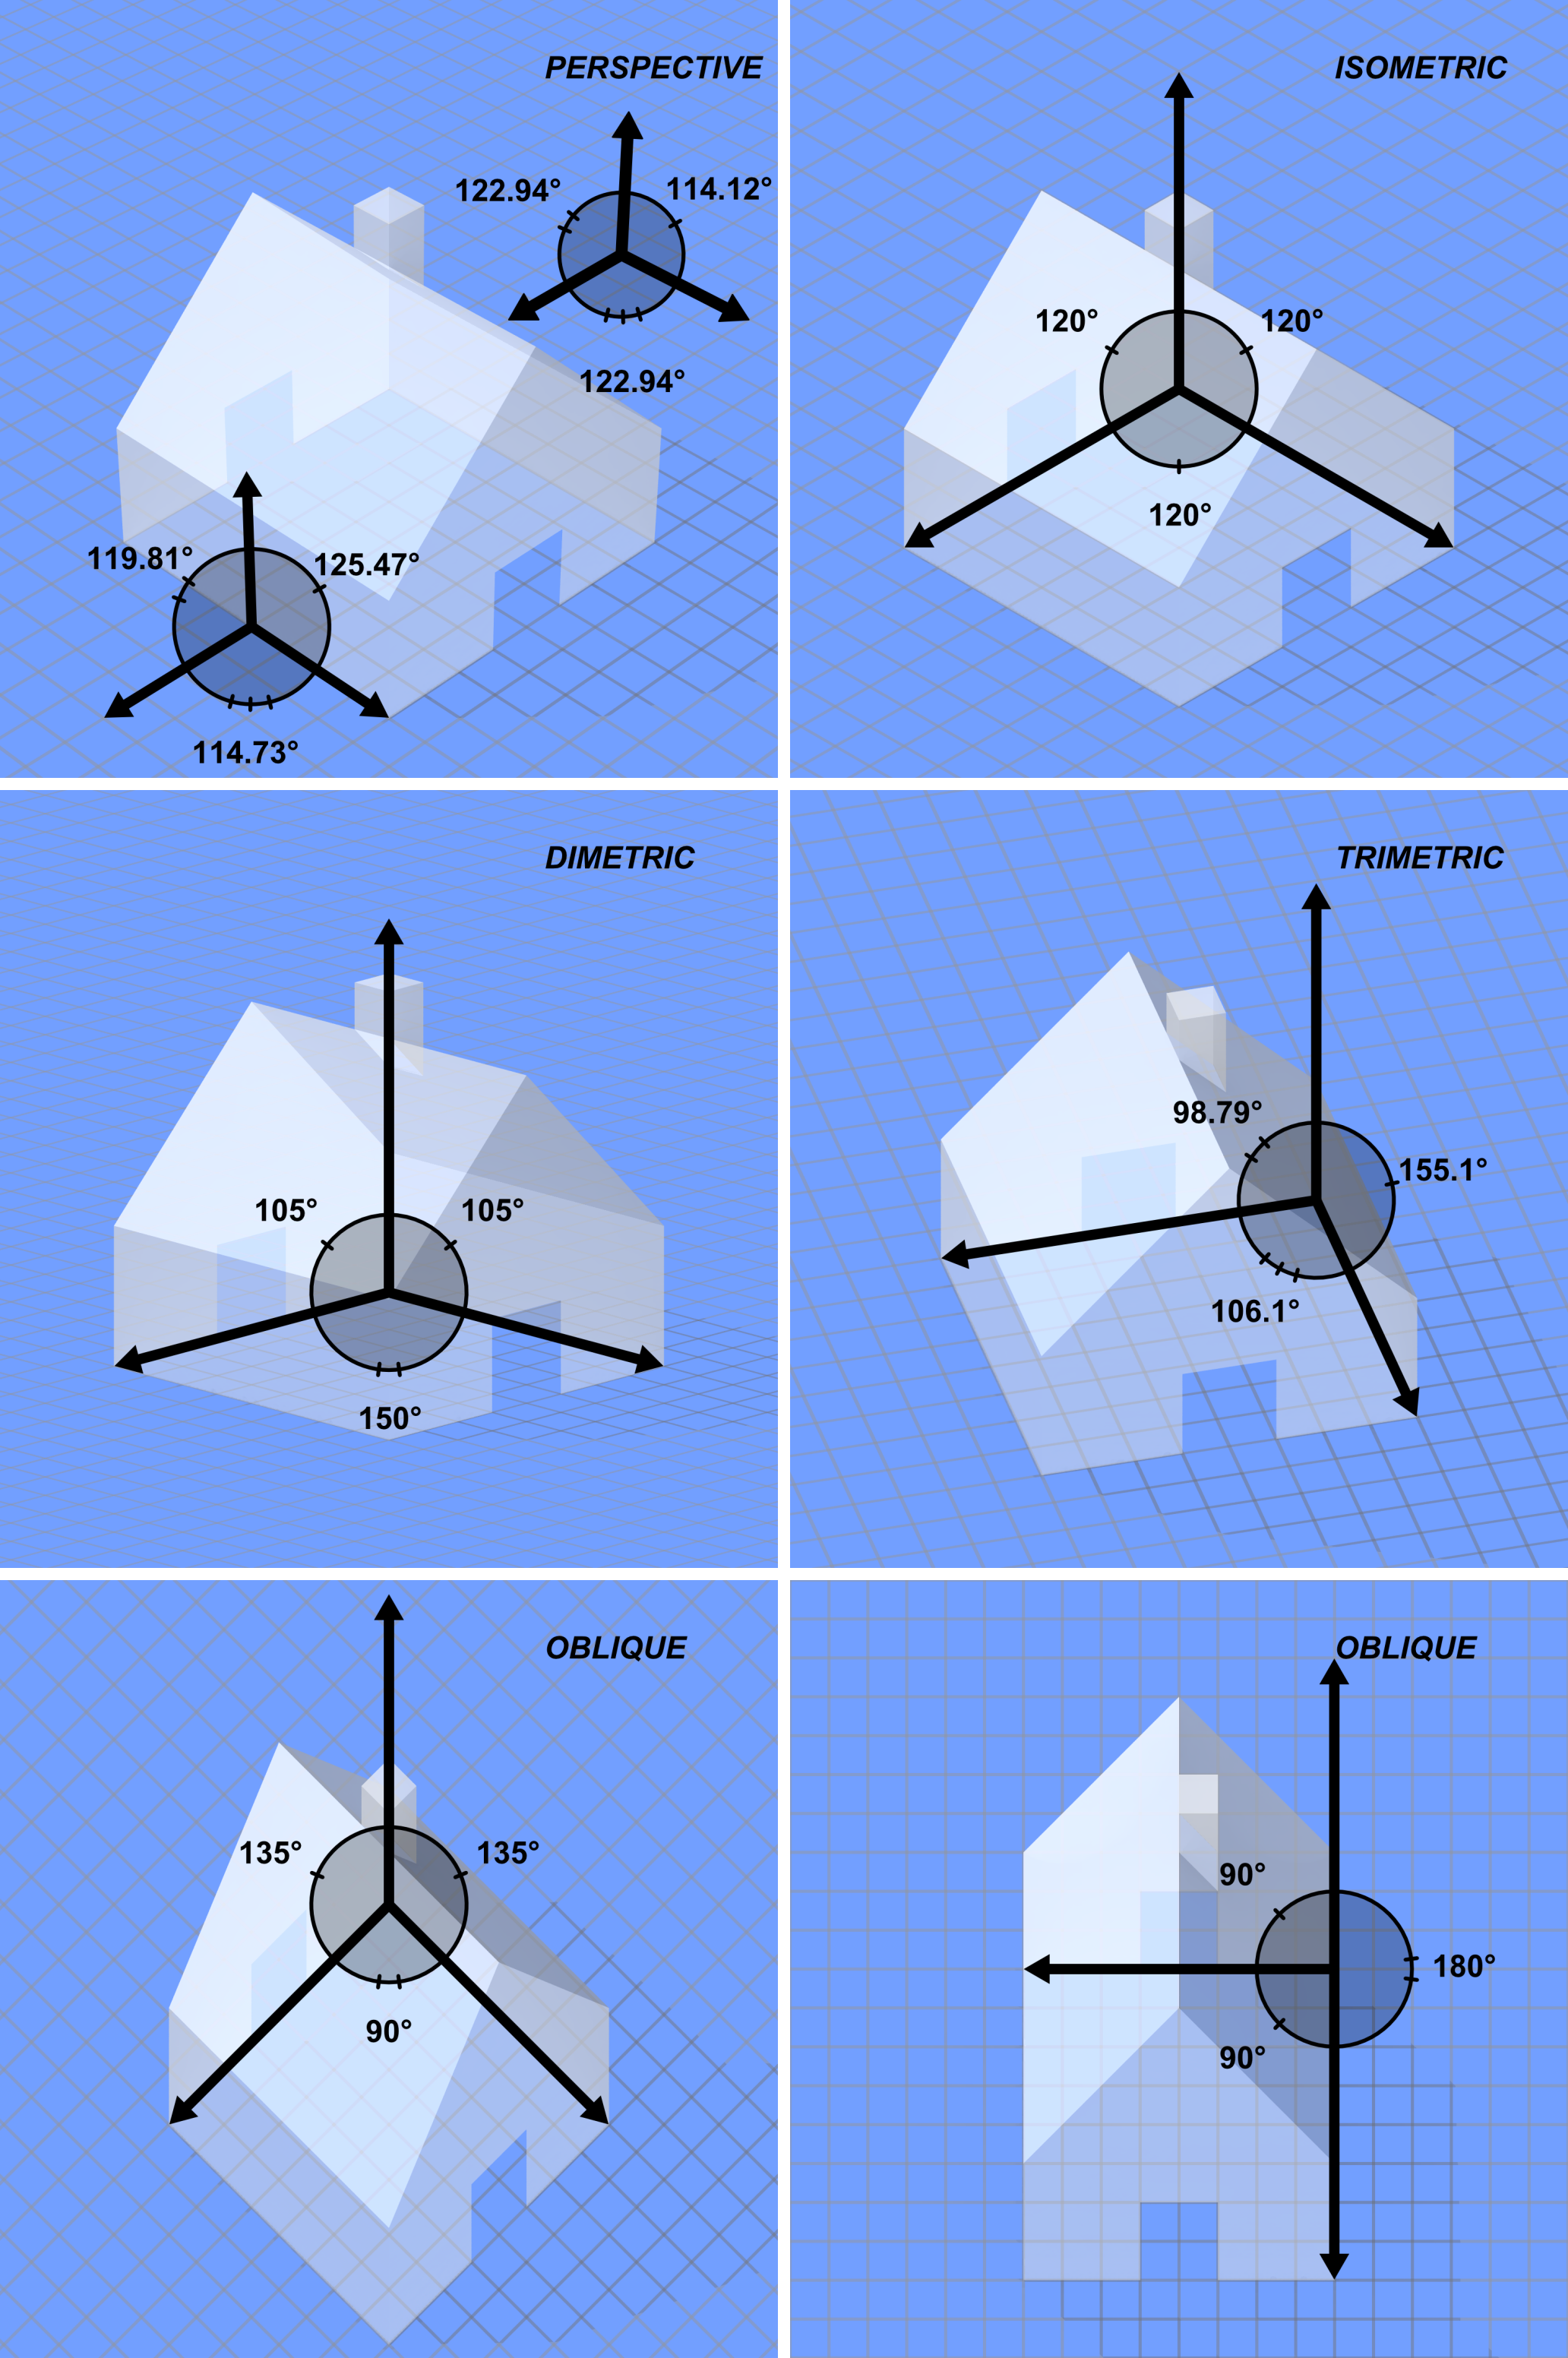
I created this illustration to show the differences between several
types of graphical projection. I then created the arrows and angle
measurements in GeoGebra using the 2D coordinates returned by my new
"Get_Screen_XY" macro (see the "screen.inc" thread in p.b.s-f). Finally,
I merged all six images into a single image using the "Contact Sheet"
tool in XnView.
Mike
Post a reply to this message
Attachments:
Download 'graphical_projection_comparison.png' (2519 KB)
Preview of image 'graphical_projection_comparison.png'

|